
History, sessions and the log
What you ran, what is running on the server, and what TableCraft itself did.
Query history and Services
Section titled “Query history and Services”Every statement you run is kept per data source in a local history.
Reuse a statement from history
Section titled “Reuse a statement from history”- Choose Query History… or press
⌥⌘E. - Type to search the history.
- Press
↩on a statement. It goes in at the caret.
Format lays the preview out with your formatting settings for reading; Copy and Insert keep the statement as it ran.
Follow executions in Services
Section titled “Follow executions in Services”The Services tool window (⌘8, closed until you open it) shows each connected data source, a
session per tab, and its recent executions with outcome, rows, duration and start time. When a
plugin changes a statement before sending it, such as adding a time-limit hint, Services and the
history both show the text that reached the server.
The fold button in its header is Collapse All while anything is unfolded and Expand All once
everything is folded; ⌘- and ⌘= with focus in Services do the same.
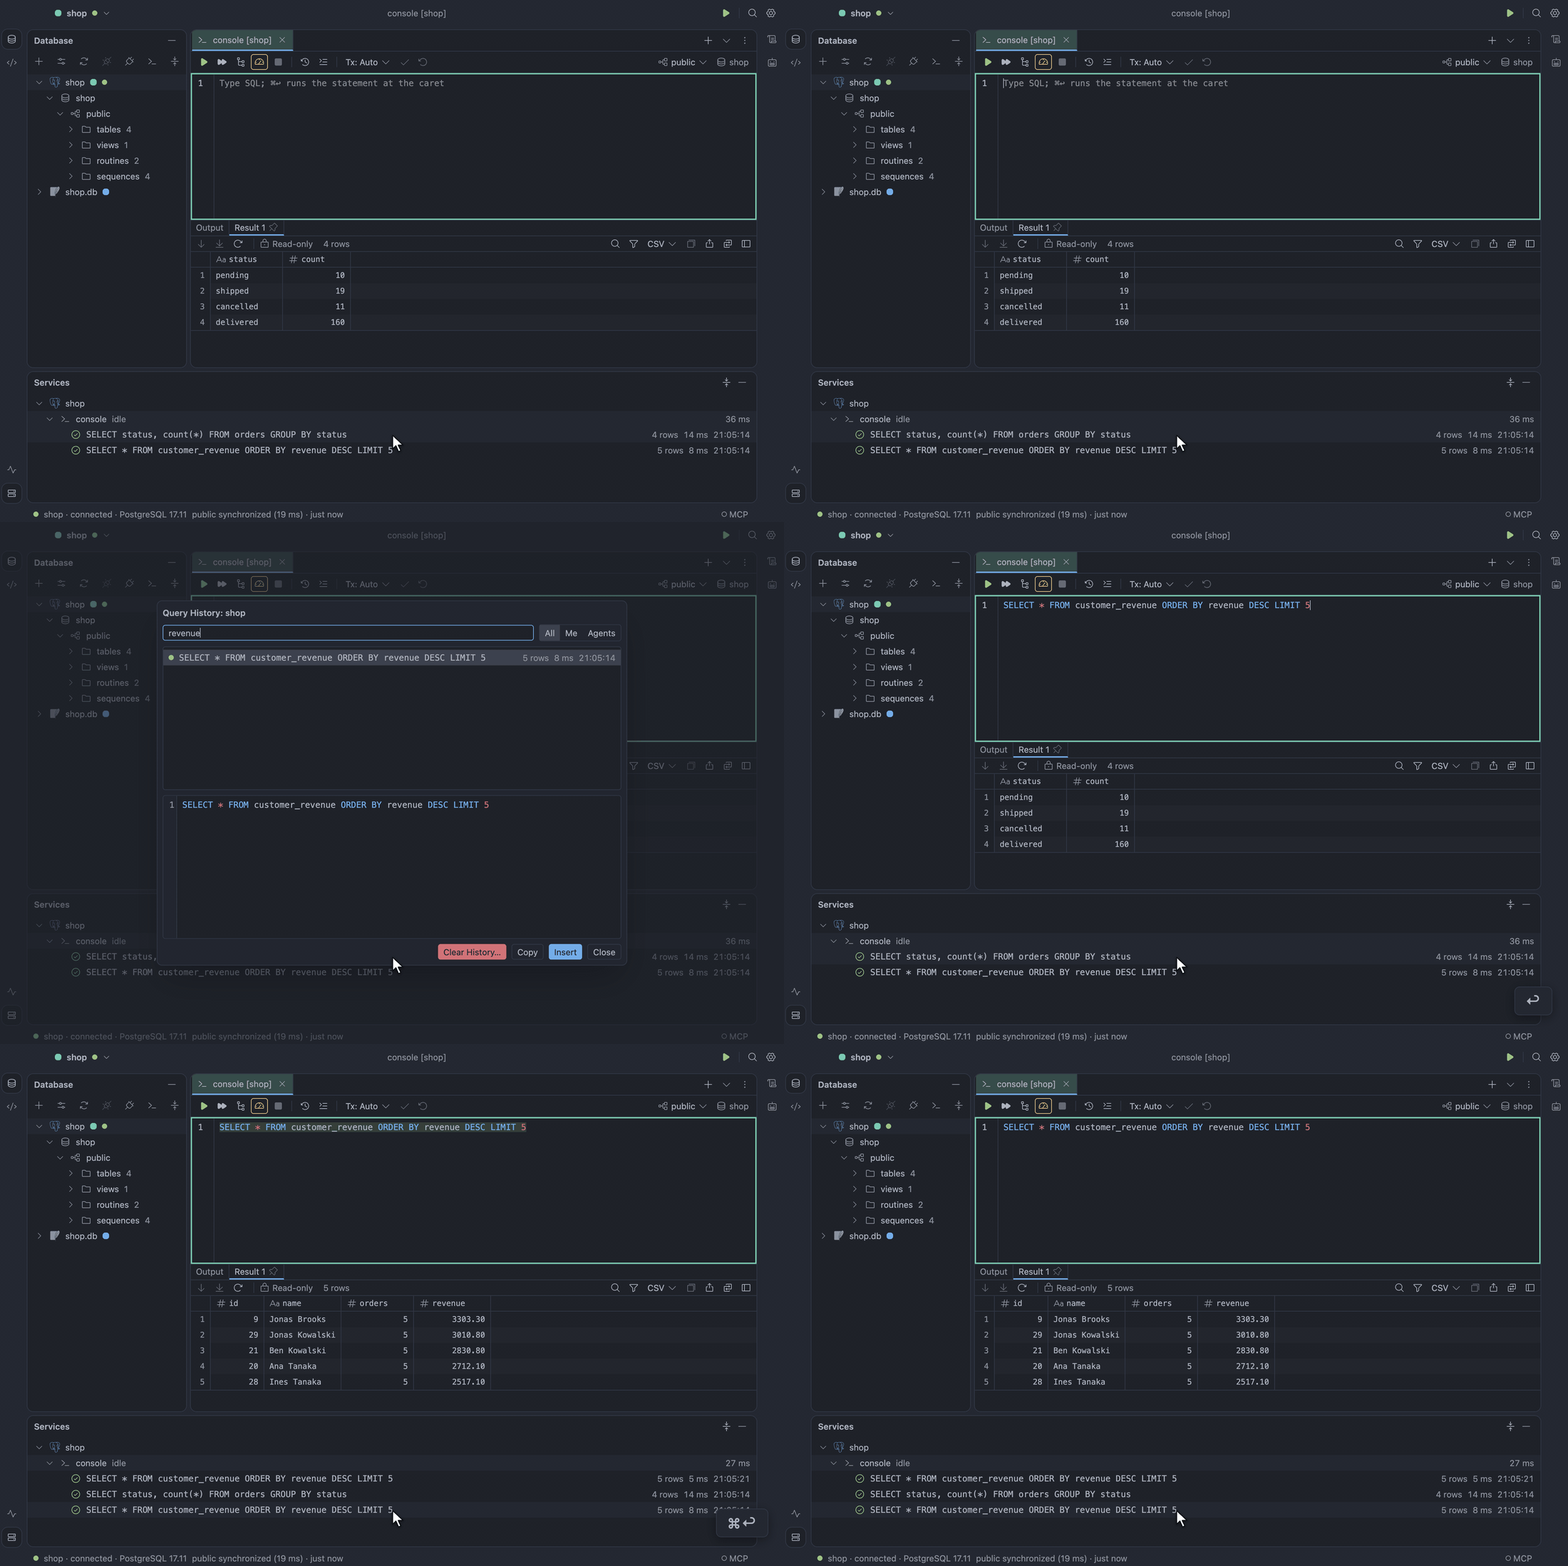
See Query history and Services.
Sessions
Section titled “Sessions”Show Sessions… on a data source opens a tab that lists every session on the server: its PID, state, user, database, client, how long its query and transaction have run, what it waits on, and the sessions blocking it. Sessions idle in a transaction are tinted amber and blocked ones red; yours are tagged. PostgreSQL, MySQL, TiDB and Oracle support it; when your account cannot see everything, the tab says which grant to ask for.
Find a session
Section titled “Find a session”Filter by Hide idle, Hide system or Blocked only, or search. Refresh Sessions reads the list again, and Auto-Refresh Sessions does so every few seconds.
Stop or inspect a session
Section titled “Stop or inspect a session”Select a session to see its full query, then choose what to do with it:
- Open Session Query in Console: opens its query in a console.
- Explain Session Query: explains its query.
- Cancel Session Query: cancels its query.
- Terminate Session…: terminates it after you confirm the exact statement. On a data source coloured red you type the PID to confirm.
A read-only data source cannot stop anything.
Find a console’s own session
Section titled “Find a console’s own session”To select the console’s own session, choose Show in Sessions on an execution in Services.
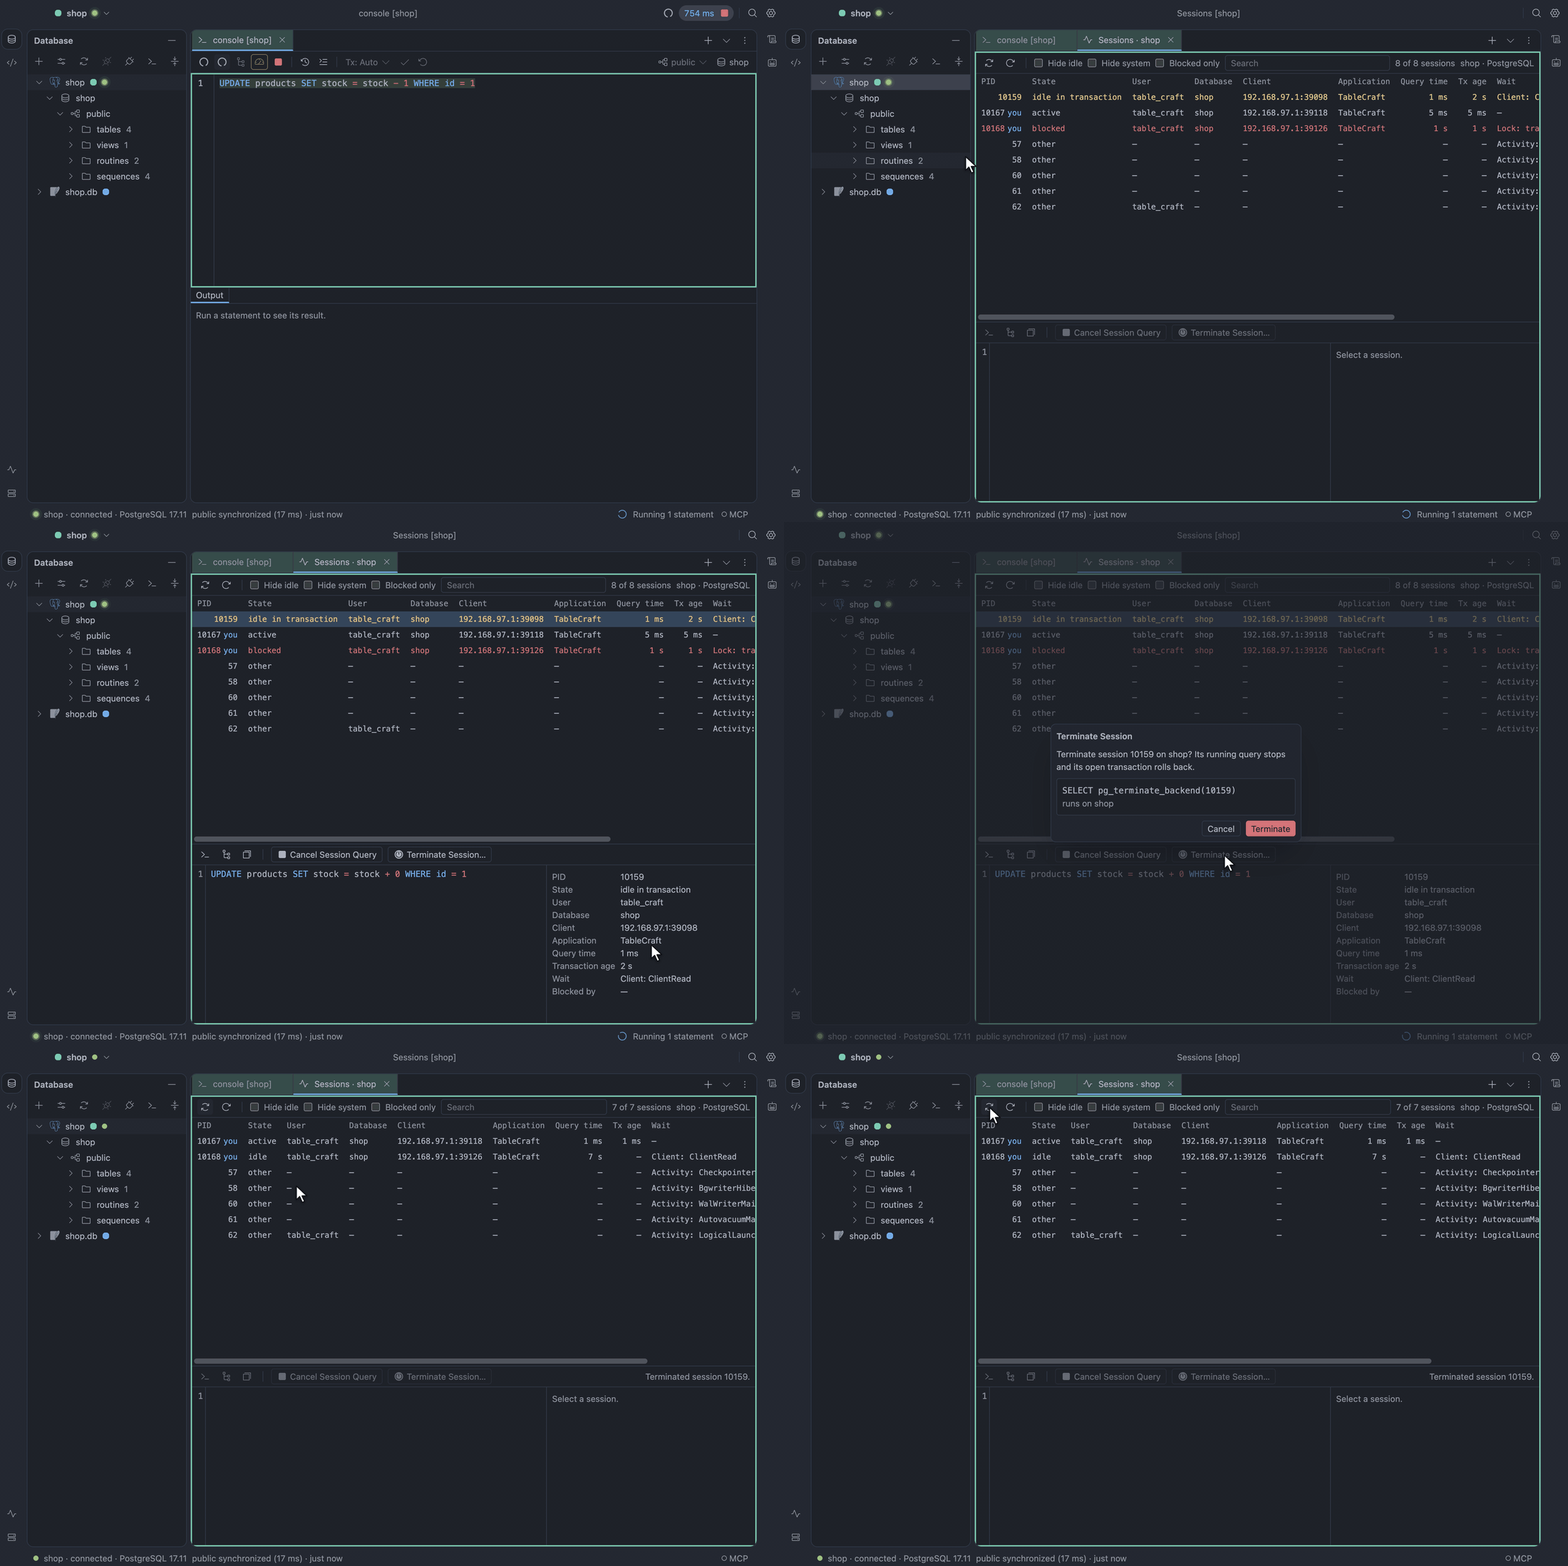
See Sessions.
App log and diagnostics
Section titled “App log and diagnostics”TableCraft keeps a log of what it does: launches, connections, statements by kind, row count and
duration, exports, engine restarts and errors. It records no passwords, no row values and none of
the SQL you run. What agents do is logged under the agent scope: each client that connects and
leaves, every tool call with the statement it sent, and every approval asked and how it was
answered.
Read the log
Section titled “Read the log”To open the Log tool window, choose Help → Show Log. It lists records newest first, with filters
for level, scope and text. An error notice’s Show in Log opens it on the records of that
request, and Show Agent Log opens it on the agent records.
Export diagnostics
Section titled “Export diagnostics”To attach diagnostics to a bug report, choose Help → Export Diagnostics…. It saves a zip with the logs (including the statements agents sent), versions, settings, data sources without credentials and recent run metadata.
Record every request
Section titled “Record every request”To record every request while reproducing a problem, turn on Debug logging in Settings → Advanced.