
Elasticsearch and OpenSearch
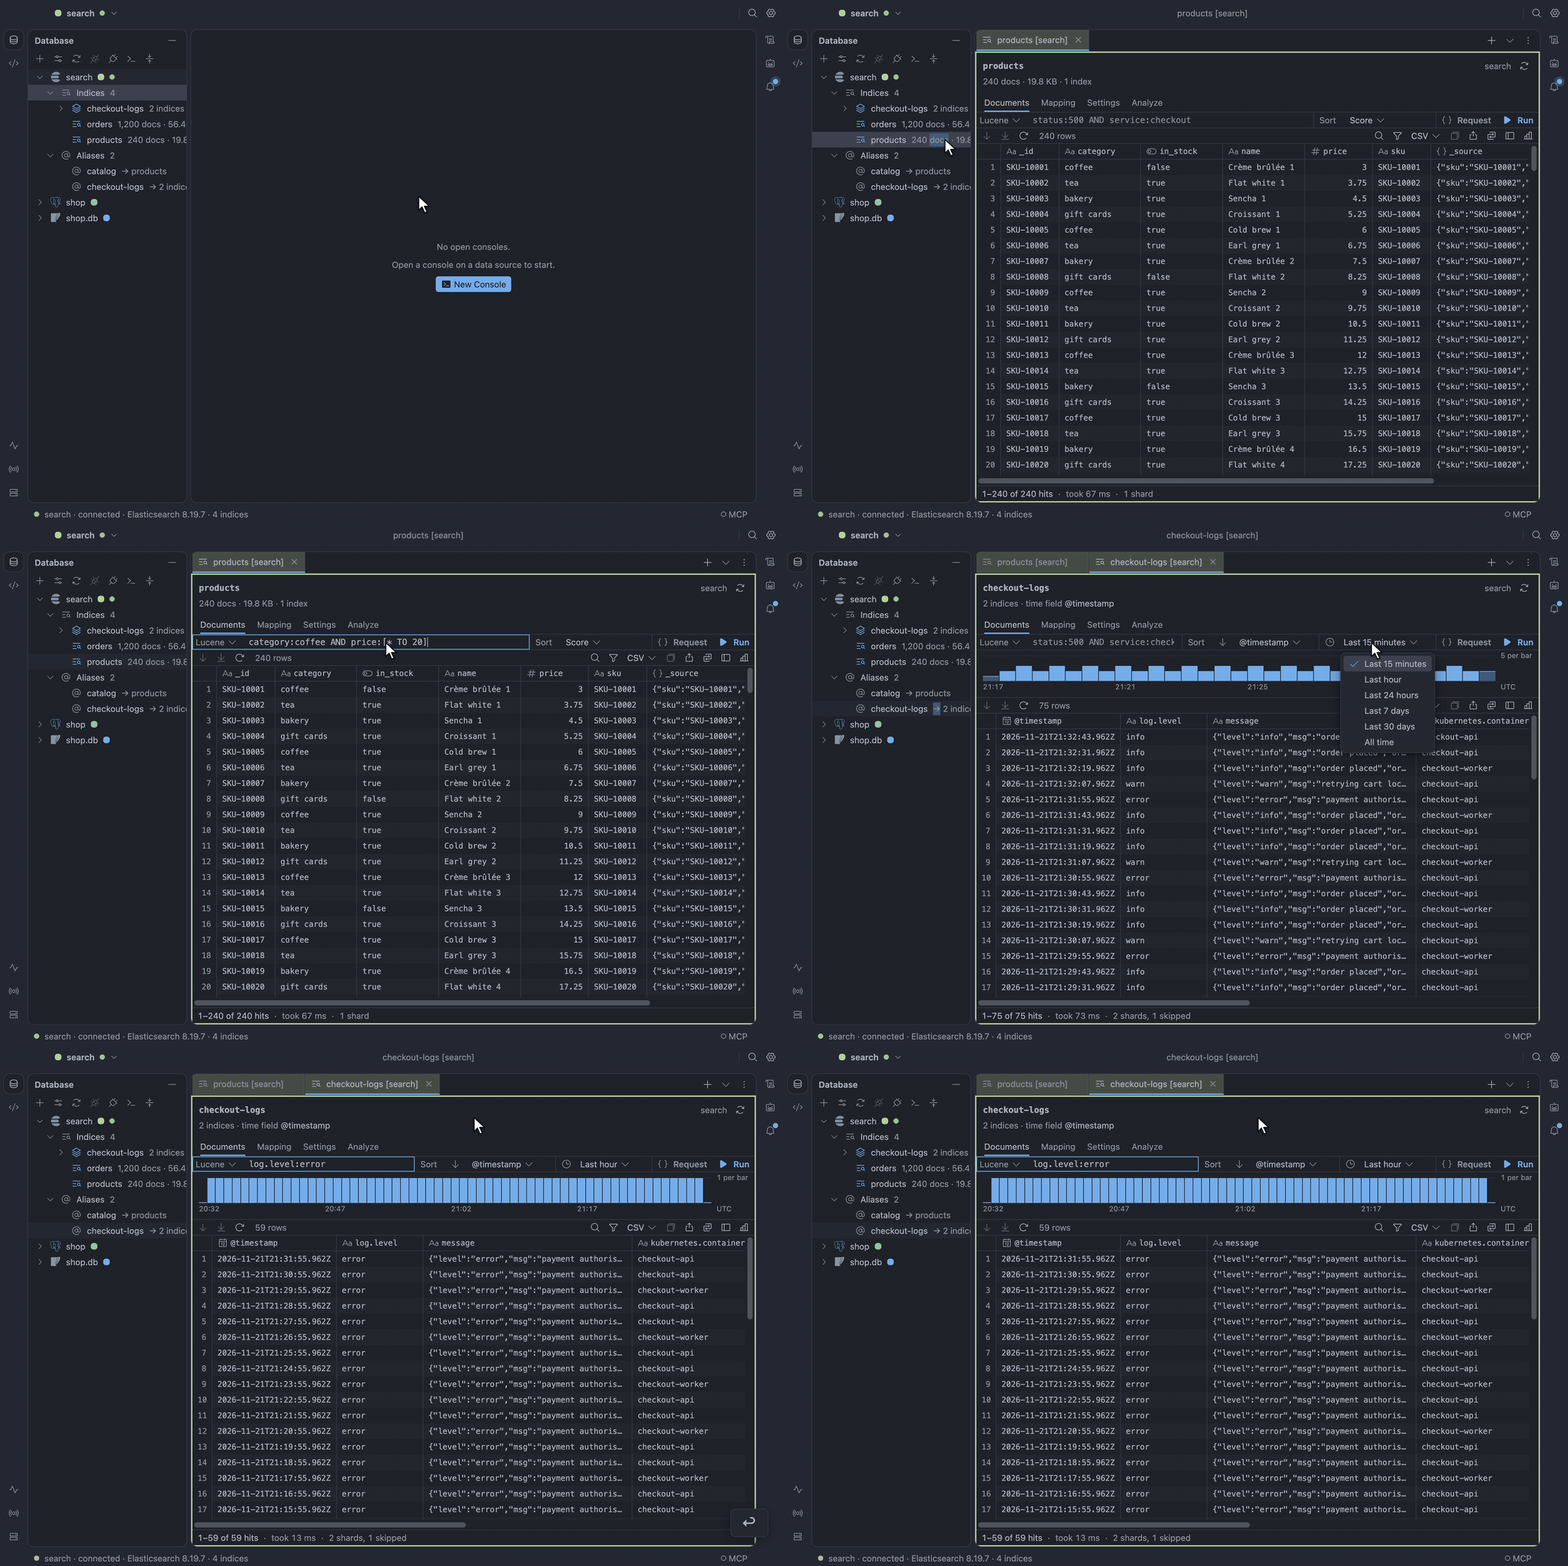
The Elasticsearch plugin speaks Elasticsearch 6.0 and later and OpenSearch 1.0 and later over their REST API, with no driver of its own (decision 173). It downloads the first time you add an Elasticsearch or OpenSearch data source. Indices list in the Database pane, an index opens in a tab you search from, and the console takes Dev Tools requests.
Connect
Section titled “Connect”Give the Host and Port of one node (9200 by default). TableCraft talks to the node you name and never discovers the others.
Pick the Authentication:
- None.
- Username and password: basic authentication.
- API key.
- Bearer token.
Passwords, API keys and tokens are kept in your system keychain like any other secret.
Pick the TLS mode:
- Off (http): plain
http. - Verify full.
- Verify CA.
- Require (no verification): encrypted, without checking the certificate.
The advanced fields take a CA file and a client certificate and key. A cluster behind a proxy that
serves it under a path, such as /es, takes that path in the advanced Path prefix.
On connect, TableCraft reads the cluster’s version and adapts to it: mapping types on 6.x, the shape of hit totals, the date histogram’s interval and the SQL endpoint.
When GET / is refused or times out, as it can behind a gateway or proxy, TableCraft asks the node
it reached (_nodes/_local/version) and then _cat/nodes, taking the oldest version there. That
last answer names no distribution, so a version below 6 reads as OpenSearch.
List only some indices
Section titled “List only some indices”On a cluster shared by many teams, fill in the advanced Index filter with globs separated by
commas, such as logs-*, products. The tree then lists only the indices, aliases and data streams
whose names match. A console request or a tab opened by name still reaches any of them.
Database tree
Section titled “Database tree”The tree has four folders:
- Indices, each with its document count and size, such as
2,431 docs · 1.2 MB. The server counts them, so an index withnestedfields counts each nested object too. A yellow or red index shows its health beside the name. - Data streams, with their backing indices.
- Aliases, with the index they point at.
- Hidden, for system indices whose names start with
., folded away with their count.
Indices that roll over (logs-checkout-000411, logs-checkout-000412) or carry a date
(audit-2026.11.20, logs-billing-2026-09-0001) fold into one family row, newest first. Other
names fold on the part before the first . when two or more share it.
Filter the tree
Section titled “Filter the tree”Past 200 indices, a filter row sits at the top of the data source’s indices. On a smaller cluster, choose Filter Indices… in the command palette to show it.
Type part of a name, or * for any characters: logs-*-2026. Press Escape to clear the filter.
While the filter is set, only the matches stay, inside their families and folders, opened, with
12 of 8,760 beside the box.
Index tab
Section titled “Index tab”Opening an index, an alias or a data stream shows its Documents, Mapping, Settings and Analyze views.
Documents is a result grid with one row per hit: _id, the index when the target spans several,
the score when the hits are not sorted, a column per field, and the whole _source as JSON. A
narrow mapping shows every field. A wide one, such as a log index with a hundred fields, starts with
the time, the level, the message and a few keyword fields. A field missing from a document reads
<null>.
Search an index
Section titled “Search an index”- In the query bar, pick Lucene or DSL.
- Type the query. Lucene reads
category:coffee AND price:[* TO 20], and every term is required unless you writeOR. DSL takes a Query DSL object:{"term": {"sku": "p-1"}}. - Pick a field to sort on, and its order.
- Press Enter or click Run.
The hits fill the grid. An error from the cluster shows under the bar and keeps the rows of the last search.
Search a time range
Section titled “Search a time range”When the target has an @timestamp date field, the bar offers a time range, Last 15 minutes by
default, and sorts newest first. A histogram of the hits over the range sits above the grid. It
shows the hits per bar its height stands for and the time, in UTC, under every quarter. A bar the
range cuts short reads paler. The footer says how many shards the range let the cluster skip.
An agent can open the view with a query, a sort and a range of its own. A range with fixed ends shows in the menu as its dates, in UTC, until you pick another.
Page through the hits
Section titled “Page through the hits”The first page is a plain search that leaves nothing open on the cluster. Scrolling the grid past it opens a point in time (Elasticsearch 7.10+, OpenSearch 2.4+) and reads on from the last row shown, so no row repeats or goes missing. Older servers use a scroll.
Either is released when the last page arrives, the result is released, the tab closes or the
connection ends. A cluster that refuses the release gets one warning, and the cursor expires after
5 minutes. On OpenSearch, paging past the first page sorts by _id as a tiebreaker.
The footer reads 1–100 of 2,431 hits · took 6 ms · 5 shards. Past 10,000 the count reads
≥ 10,000. Shard failures show as a warning with the reason.
Turn a search into a console request
Section titled “Turn a search into a console request”Click Request to see the exact request the search sent. Copy Search Request copies it, and Open Search Request in Console opens it in a console where you can change it.
Read the mapping and settings
Section titled “Read the mapping and settings”Mapping lists each field with its type, analyzer and multi-fields (name.raw under name), and
the mapping as JSON. On 6.x the header names the mapping type. Settings shows the index settings
as JSON.
Analyze text
Section titled “Analyze text”Open Analyze, pick a text field and type some text. Each step of the field’s analyzer shows what it makes of the text: the tokenizer, then each token filter in turn, with the tokens a step dropped struck out. When a query finds nothing because a filter dropped a short word, this view shows why.
Find a missing privilege
Section titled “Find a missing privilege”A view the signed-in user may not read, such as an index’s settings, says so inside that view with the cluster’s reason, which names the missing privilege. The rest of the tab and the tree keep working.
On a cluster with per-index permissions, a refused search shows under the bar, and a refused
histogram above the grid with the hits still shown. A refused _analyze shows in Analyze. Each
names the action, such as indices:data/read/search, and the privileges that grant it.
Console
Section titled “Console”The console reads requests the way Kibana Dev Tools and OpenSearch Dashboards write them: a
METHOD path line, then a JSON body on the lines under it. _bulk and _msearch take one JSON
object per line. Lines starting with # or // are comments.
GET products/_search{  "query": { "match": { "name": "flat white" } },  "aggs": { "by_category": { "terms": { "field": "category" } } }}
GET _cat/indices?v
SELECT category, COUNT(*) AS n FROM products GROUP BY category;
Completion offers the methods at the start of a line, then endpoints such as _search and
_cat/indices and the cluster’s index names after the method, and Query DSL keys inside a body.
Read the results
Section titled “Read the results”- A search shows its hits as a grid, and each aggregation as a grid of its own, one row per bucket, which you can chart.
_catrequests show as a grid.- A line starting with
SELECT,SHOW,DESCRIBEorEXPLAINgoes to the cluster’s SQL endpoint. On OpenSearch, a line starting withsource=goes to PPL. Their answers show as a grid. - Any other answer shows as JSON in Output.
Run a request that changes data
Section titled “Run a request that changes data”Reads run at once. DELETE <index> deletes the index and every document in it, so TableCraft asks
you to type the data source’s name first, as it does for a DROP in SQL. Deleting _all, a data
stream or a template asks too. A _delete_by_query that matches every document is marked as costly,
and a _bulk with delete actions as destructive.
A read-only data source refuses every request that would change something before it is sent.
Cancel a request
Section titled “Cancel a request”Click Cancel to stop the running request by closing its connection. Elasticsearch 7.4 and later and OpenSearch then stop the search on the cluster too.
Limits
Section titled “Limits”- Every search, count and histogram asks the cluster to stop after 30 seconds. A search that ran out shows the hits it found with a warning. A count that ran out fails, so it never shows a wrong number.
- A search in the index tab keeps at most 128 MB of rows. Past that the footer says it stopped, and a narrower query or time range reaches the rest.
- A field or
_sourcelonger than 32,768 characters keeps its start and….GET <index>/_doc/<id>in the console reads the whole document. - A page whose reply would pass 64 MB is asked for again ten times smaller.
- A family of hundreds of indices reads the mapping of its last four by name, the newest, and says so.
- In the console, a reply past 64 MB is dropped unread with advice to ask for less (
size,_source,filter_path). Output shows the first 256 KB of a longer JSON answer, and a search grid keeps at most 128 MB of hits and says how many it showed. - Documents cannot be edited in the grid, and there are no dialogs to create or delete indices and aliases: write the request in the console instead.
- Kibana Query Language (KQL), index lifecycle policies, snapshots, and security users and roles are not supported.
- Elasticsearch 5.x and older are not supported.